Visualization
In this topic it is shown how to set the visualization settings to display the structure with the colors and the visualization settings shown in this tutorial.
|
Note! For more information about visualization in GeoDict refer to the Visualization User Guide. |

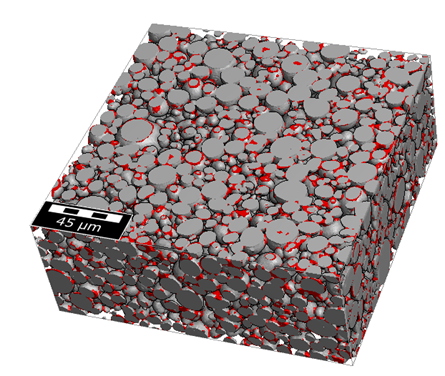
Apply the visualization settings after loading the corresponding structure files by following this tutorial. If you want to do it now, load the structure with binder from the Results-M2M folder. For this, select File → Open Structure (*.gdt, *.gad) from the menu bar. Browse for the Results-M2M folder inside the tutorial folder and select the GeoDict structure file labeledStructure.gdt from the 2_IdentifyBinder_M2M folder. Click Open.
- Visualize the structure in 3D by clicking the icon in the toolbar or select View → 3D Rendering from the menu bar.

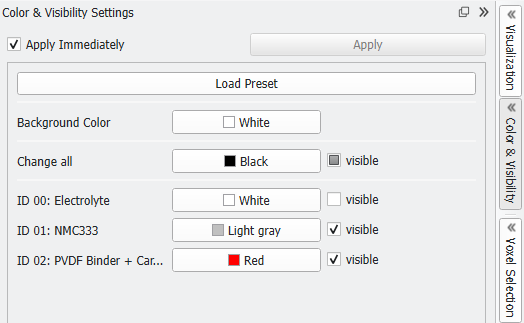
- In the side bar of the GeoDict GUI, select Color & Visibility.
- Change the color for ID 01 from red to Light gray. This will be the ID used for the NMC grains. Change the color for ID 2 to Red. This ID is used for the binder material in the second unit of this tutorial. Close the Color & Visibility Settings side bar.
- Select the Camera tab in the View Controls, above the Visualization area, and check Show Outlines, Show Halo, and Shadows to improve contrast.
- For the camera position used in this tutorial enter
- -20 for Rotation HDG,
- -8 for Rotation ATT,
- -46 for Rotation BNK, and
- 0 for the translation and local rotation parameters.
- Select the Structure tab in the View Controls, above the Visualization area, and from the pull-down menu for Structure Renderer select Smooth.