Comparison of Results
To compare the pressure drop for both cases, we merge the two result files of the flow simulations to get a combined plot of the layered pressure curves.
- First, check that the result file Stokes-Cylinder-4-holes.gdr is still opened or open it via File → Open Results, if not.
- In the Result Viewer of this result file, click Open… and search for the file Stokes-Cylinder.gdr. Select both files simultaneously by pressing CTRL while clicking on the result files to see them side by side. Check Synchronize Tabs to display the same tabs for both result files.
Go to the Results - Report subtab and observe that the pressure drop of 312 Pa for the cylinders with holes as catalysts is higher than the pressure drop for the filled cylinders (254 Pa). - Go to the Results - Plot subtab and observe the Pressure plots of both result files.
- To directly compare the pressure drop, velocity, and convergence plots of both result files we create a combined gdr file. This is an easy way to compare the results of multiple runs of the same command.
- Make sure, that the two result files Stokes-Cylinder-4-holes.gdr and Stokes-Cylinder.gdr are still both selected in the result viewer. Then, click the Combine Results button at the top right below the GeoDict logo.
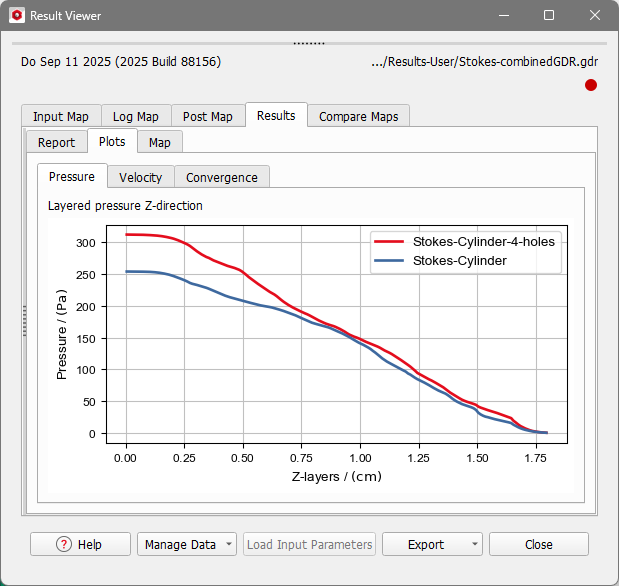
- Change the Result File Name to Stokes-combinedGDR.gdr. We use the combine mode Color, so the data from each source gdr file will get an individual color. Click OK to combine the results of the two result files into a new result file. This file will also be saved in the project folder and the result viewer opens automatically when it is finished.
- The Results-Report tab shows the names of the source gdr files, from which this file was created. Go to the Plots tab to observe the combined Pressure plot. You can see, that the pressure for the cylinders with holes as catalysts is higher in each Z-layer of the structure.