Visualize the 3D Structure
As soon as the structure generation is finished, the generated structure appears in the visualization area (also named viewport) in a 2D view.
In this section, you will learn how to slice through the structure, how to rotate and zoom using the mouse. We will change the colors and visibility of each material.
- The View Controls panel is located above the Visualization area. By default, the tab Structure is active.
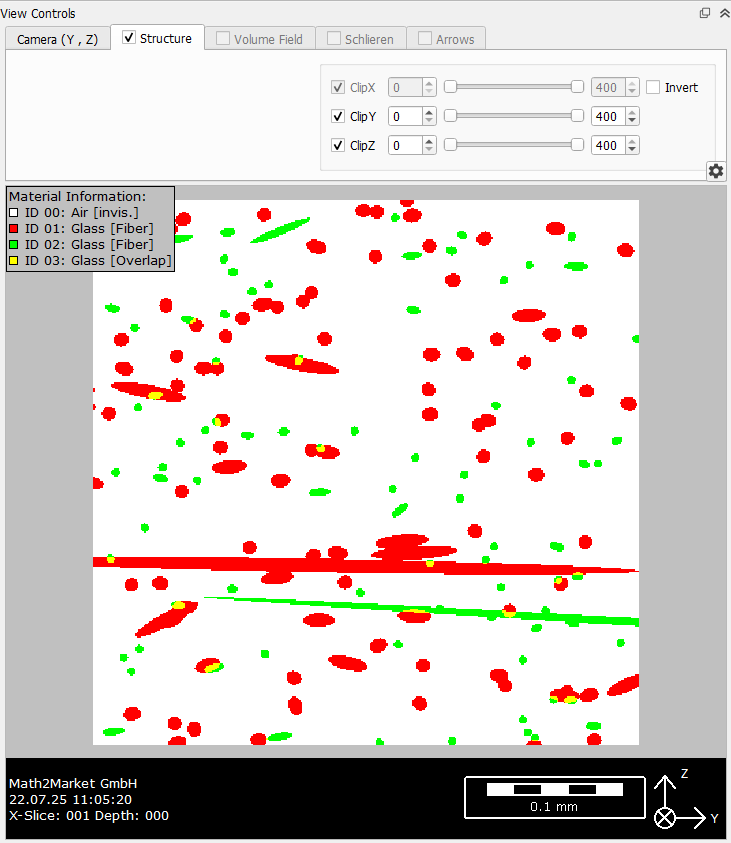
- Choose the Camera (Y, Z) tab from the View Controls panel. Zoom in and out either by clicking
 and
and  or directly by clicking in the Visualization area. Holding the right mouse button and moving the mouse forwards/backwards zooms in and out.
- Slice through the structure either by moving the slider or by resting the cursor on the structure and scrolling the mouse wheel.
- Change the Depth value to look deeper in the structure by moving the corresponding slider.
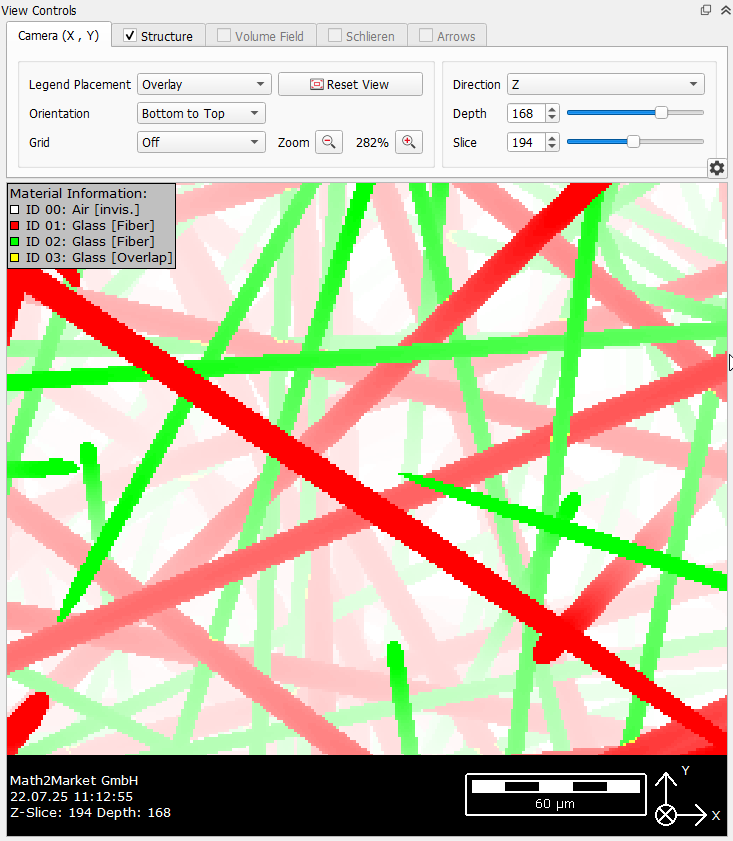
- Change the direction from which to view the structure using the pull-down menu next to Direction. For example, by selecting Z, the structure is viewed from Z-Direction.
- The structure can be visualized in 3D by selecting View → 3D Rendering from the menu bar. Alternatively, click the
 icon in the toolbar. The
  icon to the left changes the view back to 2D.

- By default, the structure is viewed from the top, i.e. from Z-direction. Rotate the structure with the cursor, by left clicking on it and dragging.
- All changes to the camera position are set back to default by clicking the Reset button in the Camera tab above of the visualization area.
- To improve the three dimensional perception, you may open the Camera tab and enable the Show Outlines, Show Halo and Shadows features.
- The Status box on the left side of the GeoDict GUI contains Statistics about the currently visualized structure. Expand the Statistics row. For each Material ID, visualized with different colors, the volume fraction and the number of voxels is shown. Here, the pore space has material ID 00 and makes up ~90% of the volume. The different fiber types are assigned to ID 01 and ID 02. The location where fibers overlap with each other is marked as material ID 03. All three solid materials are assigned to be glass.
Alternatively, hover with the mouse pointer over the material fractions bar to see the same 3D statistics as a tooltip.
- You can change the color of each material ID by selecting Settings → Color & Visibility Settings in the menu bar. Alternatively, click on the corresponding icon
 in the toolbar, or just unfold the Color & Visibility panel on the right.
Change the colors for all glass material IDs, i.e. ID 01, 02, and 03, by clicking on the color and selecting the desired color from the menu. We chose Light gray for ID 01, Dark gray for ID 02 and Gray for ID 03. Observe that ID 00 is set to invisible. This is the default, as in most cases the pore space is assigned to this ID. The visibility of all material IDs can be turned on and off at any time by checking or unchecking the corresponding visible checkbox in this dialog. Retract the dialog by clicking the button in the upper right corner.