Visualize and Analyze Filtration Results
After the simulation has finished (which may take about 1 hour, depending on the hardware and the available number of parallel processes), the Result Viewer of the result file appears automatically.
Continue with the Visualize and Analyze Filtration Results step after you have done the Simulate Multi-Pass Test step. Alternatively, load the CompleteFilterLifetime.gdr results file from the Results-M2M folder. |
On the left side, under the Tables and Plots tabs, you can select which tables will appear on the Report tab on the right and which plots are shown under the Plots tab on the right.
The Filter Efficiency table shows the reached efficiency for each of the batches:
- The test reservoir volume is initially clean (see here), so no dust particles are deposited during the first time step (batch)
- Although we selected a Constant Efficiency model here, the filter efficiency decreases slightly over time, because the particle size distribution in the test reservoir changes over time. The larger particles are filtered quicker, while the smaller ones pass the filter multiple times and stay in the fluid longer.
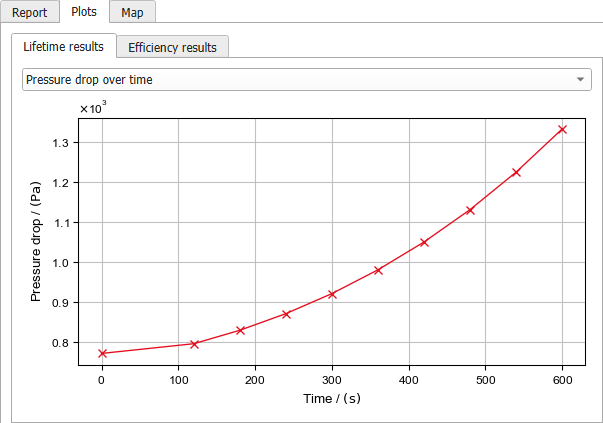
The pressure drop evolution is plotted in the Results- Plots subtab.
To visualize the filter clogging at the end of the simulated time, proceed as follows:
- Select the Particle Visualization tab and move the slider in the Deposited Dust section to the last time step, and click Load Deposited Dust.
- Switch off the Structure visualization, and activate the Volume Field visualization in the View Controls tabs headers. In the Volume Field tab, switch off Smooth to color each voxel individually. Then, set the Threshold slider to a small value, e.g., 0.001. The 3D visualization then shows all voxels that contain some deposited dust particles. After 10 batches, dust has been deposited everywhere in the pleated filter media: