GeoDict Quantify Application examples
Advanced quantificationand visualization of 3D material structures
created by Anton Du Plessis, Ph. D.
From 3D image data to quantitative insight
GeoDict Quantify is a software package that combines image-based analysis, detailed quantification,and clear 3D visualization for microstructures obtained from micro-CT, FIB-SEM and other 3D imaging methods.
Wall-thickness
Local wall thickness analysis is an important quality parameter for evaluating thickness variations in coatings, layers,and manufactured parts with defined thickness requirements. This is available in the MatDict module.
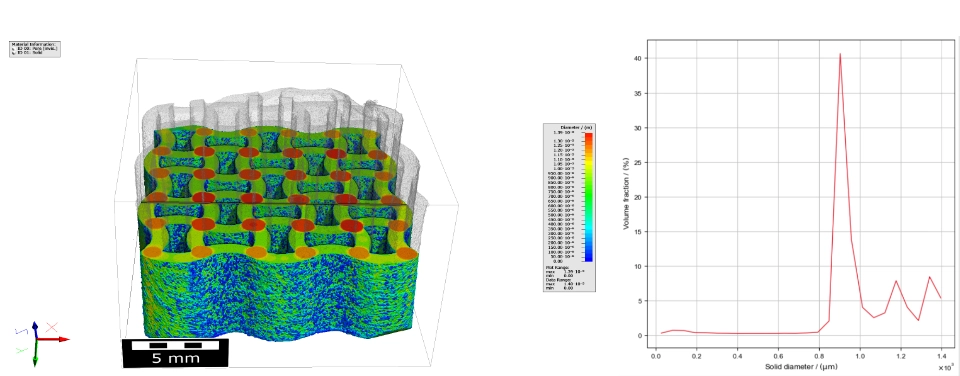
In this example, an additively manufactured sample is color-coded according to its local thickness.
Most of the sample has a thickness of about 0.9 mm (green), reflected by the main peak in the thickness distribution plot.
Secondary peaks at approximately 1.2 mm and 1.4 mm correspond to the inner and outer joints between the walls, shown in orange and red.
Fiber / composite analysis
Fiber analysis helps characterize fibrous materials and composites by measuring properties such as fiber orientation, length, diameter, and curvature, using the FiberFind module.
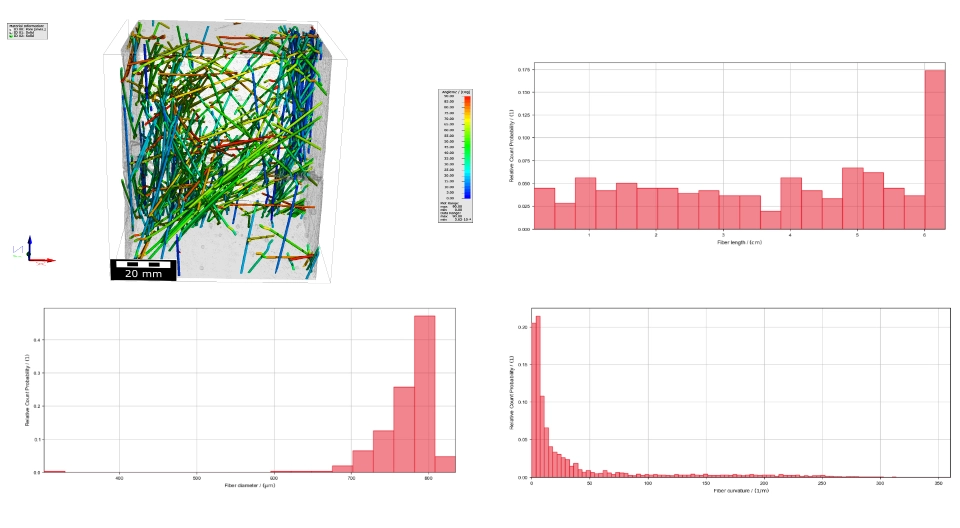
In this example, metal fibers in a concrete sample are analyzed according to their orientation relative to the Z-axis. Fibers parallel to the Z-axis are shown in blue, while perpendicular fibers are shown in red.
For the 357 identified fibers in this sample, the analysis gives a mean length of 3.67 cm, a mean diameter of 774 μm, and a mean curvature of 0.53 cm-1, together with the corresponding statistical distributions.
Porosity
Porosity analysis is one of the most common applications of micro-CT data. This is
covered in the PoroDict module.
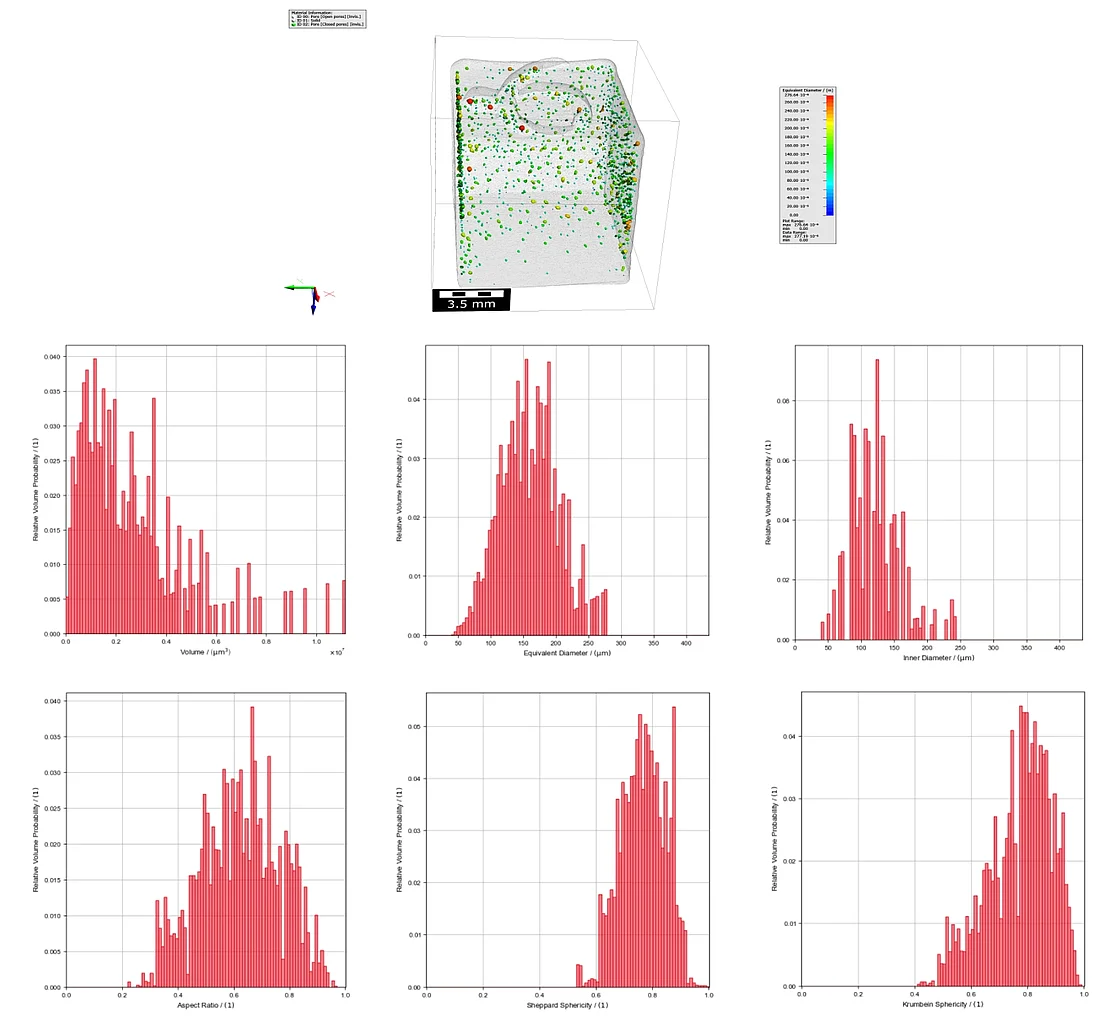
In this example, a 10 mm additively manufactured metal cube contains pores up to 0.277 mm in
diameter. The pores are color-coded by size, while statistical distributions provide information on pore
size and shape, including equivalent and inscribed sphere diameters, aspect ratio, and sphericity.
Connected porosity and tortuosity
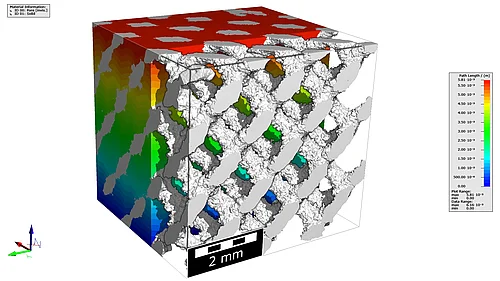
Connectivity is an important parameter in structures with large, open pore spaces. Connected porosity quantification tools are also provided in the PoroDict module.
Geodesic Tortuosity measures the complexity of paths through the microstructure. The mean tortuosity is 1.017, with a mean path length of 5.92 mm.
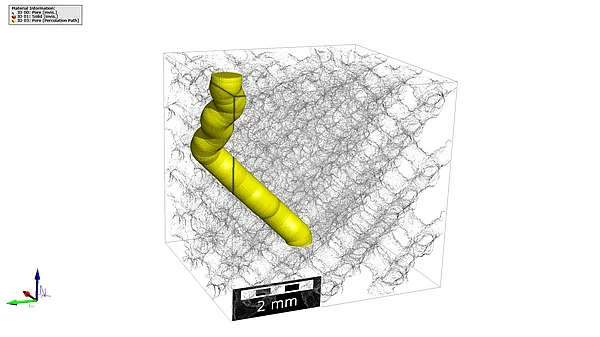
The Percolation Path determines the largest sphere that can pass through the microstructure. Here the percolation diameter is 0.79 mm, with a path length of 8.56 mm.
Particles / powder analysis
3D analysis of particles, grains, and powders can be performed using the GrainFind module.
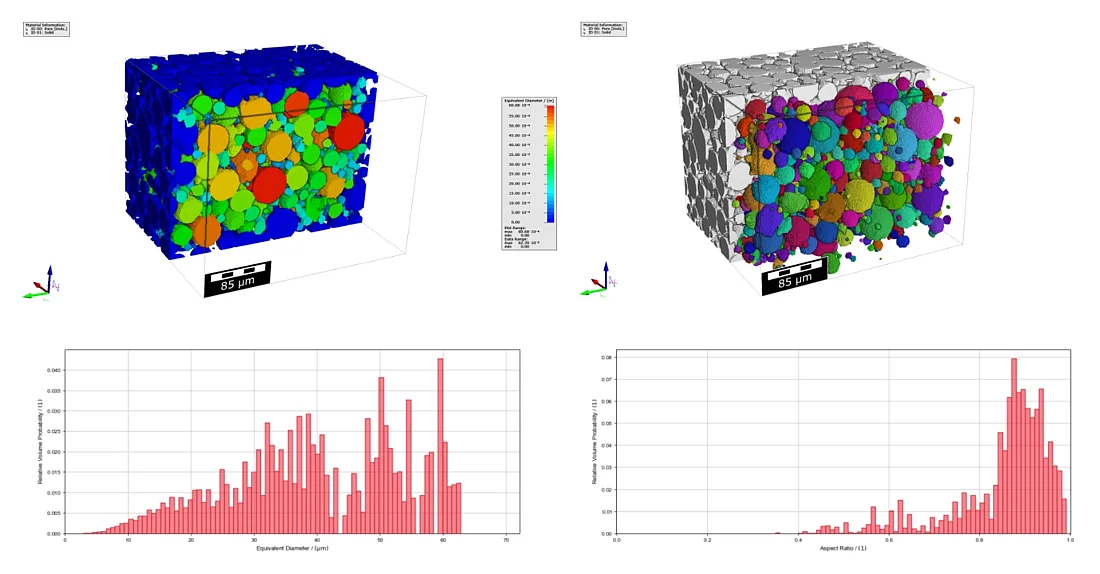
In this example, Identify Grains separates individual particles while excluding those touching the dataset boundariesto avoid measurements of incomplete grains. The particles are visualized individually and color-coded by size.
The analysis identifies 1,411 grains, with particle sizes of D10 = 20.6 μm, D50 = 30.7 μm, and D90 = 59.2 μm.
Particle size and aspect ratio distributions provide further statistical characterization.
Nominal-actual deviation
Comparing micro-CT data with a nominal design helps identify and visualize deviations from the expected geometry. This is available in the MatDict module.
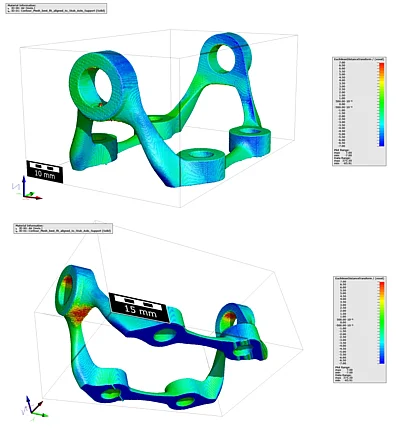
In this example, the actual and nominal geometries are aligned and compared using theEuclidean Distance Transform in MatDict. Deviations are color-coded on the surface: red indicates excess material, while blue indicates areas below the nominal geometry.
This makes it easy to locate and assess dimensional deviations, particularly in critical areas of a part.