Compression of an Aluminum Foam

Comparison of experimental in-situ CT scan and simulation in GeoDict

The deformation of foams under mechanical load is a complex process that is influenced by different types of deformation simultaneously. Plastic deformation and buckling of foam struts, for example, play an important role. The comprehensive characterization of the deformation of a foam is, therefore, not possible using classical compression tests.

Luckily, the new in-situ computed tomography (CT) technology widens the scope of these tests. For this, the deformation is performed inside the CT and is observed with a series of consecutive scans. This method offers exciting new insights into the behavior of cellular materials, such as foams.

Together with our partner Tescan, we took up the challenge of performing a compression test on an open-cell aluminum foam during an in-situ CT and subsequently simulating the process with GeoDict. We proceeded in the following steps:

  • Scanning of two foam samples by in-situ CT (by Tescan)
  • Analysis of the scans with GeoDict (by Math2Market GmbH)
  • Implementation of a simulation model based on the first scan with GeoDict (by Math2Market GmbH)
  • Verification of the simulation model on the second scan with GeoDict (by Math2Market GmbH)


What was the result?

  • An in-situ CT scan provides fascinating insights into the deformation of foams.
  • The deformation of the foam is very well reproduced by the simulation in GeoDict.
  • Experiments and simulation do not compete, but complement each other perfectly instead.
  • Working together in a highly motivated team of experts is always fun.

What does this mean for our customers?

  • All findings and solutions to challenges are used to improve the GeoDict software.
  • The user can calculate the mechanical properties of foams using GeoDict.
  • Any user can work together with our experts and solve completely new research challenges with GeoDict

Authors and application specialists

Dr.-Ing. Martina Hümbert

Senior Business Manager
for Digital Materials R&D

Andreas Grießer, M.Sc.

Senior Business Manager
for Image Processing and Image Analysis

Dipl.-Math. Sebastian Rief

Application Engineer

Dr.-Ing. Oliver Rimmel

Business Manager
for Digital Materials R&D

Book appointment online

Part 1: Image import and image processing

Approach in the simulation

First, the scans were imported into GeoDict and segmented. Animations of the deformation simulation were created using the video capabilities in GeoDict.

The open-cell foam used was manufactured by Recemat and is made of aluminum 99.7, with an estimated pore diameter of 2.5 mm and a porosity of 95%.

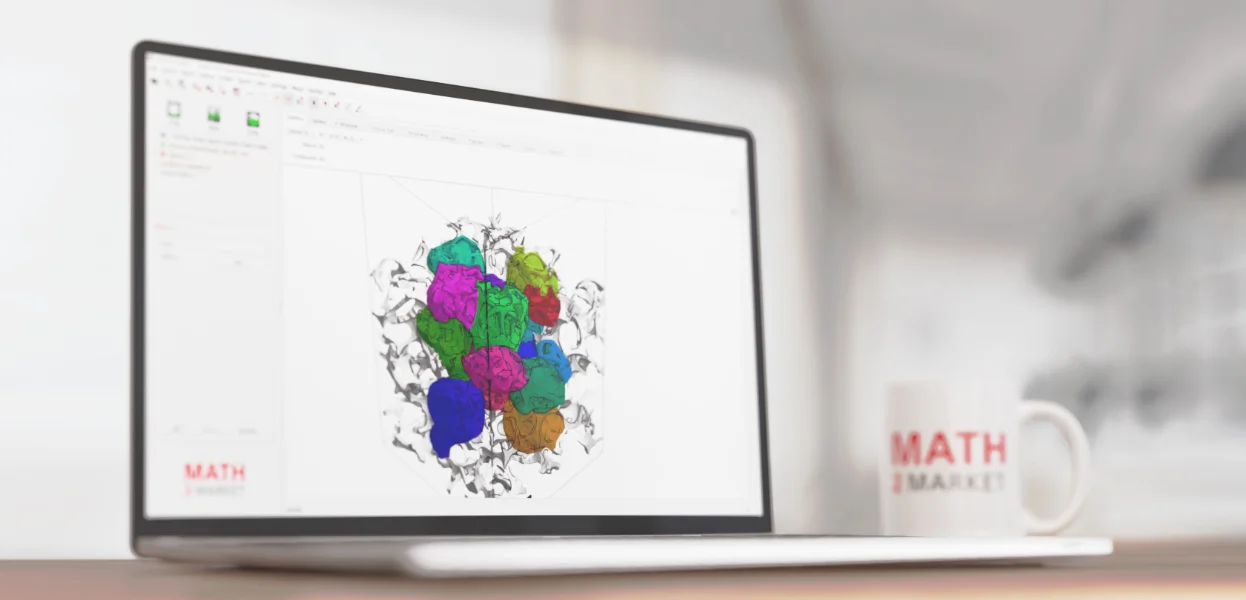
The pores were identified with a watershed algorithm using the PoroDict module of GeoDict. This identification works perfectly, even though the cells of the foam samples are quite open. Only pores that do not intersect the domain boundary were analyzed, since pores that are cut off at the boundary distort the results.

The following GeoDict modules were used:

Video of the in-situ CT scans

90 individual in-situ CT scans were taken over the course of the compression experiment. From these scans, a video of the foam deformation was then created from the CT-scans that had been automatically segmented in GeoDict.


Compression of the pores in scan 2

Part 2: Comparison of experiment and simulation

Approach

The mechanical simulations were performed using the CT scans of the uncompressed samples. ElastoDict uses the FFT-based voxel solver FeelMath, which means that the mechanical simulation can be performed directly on the CT scan without the need for mesh generation. In addition, this solver allows simulation of large compressions of foams, which is often a challenge with standard FE-based solvers.

The foam is made of Al 99.7. The simulation of scan 1 showed that the mechanical properties corresponding to heat treatment H112 are the most suitable. That means that the Young's modulus is 70 GPa, the yield strength is 23 MPa, and the elongation at break is 23%. These properties were represented by a bilinear hardening law and then, also used for the simulation of scan 2.

For the simulation, a compression of 35% was specified and symmetrical boundary conditions were defined. The tangential boundaries were assumed to be stress-free. The specimens were only slightly larger than the scanned area, so it can be assumed that the specimen could expand to the sides during compression.

Comparison of the stress-strain curves

The determined initial stiffness differs between the simulations (in red) and the experiments (in gray). The stiffness of the simulation agrees well with literature values, so the reason for the discrepancy is most likely to be found in the experimental setup. In the experiment, the foam settles at the beginning of the compression. Also, the displacement was measured by the crosshead travel, which is not precise enough to get an accurate strain at the beginning of the curve. Aside from this difference, the stress-strain curves of the experiment and the simulation agree well.


The following modules were used

Comparison of deformations in experiment and simulation based on scan 1

Comparison of deformations in experiment and simulation based on scan 2

Please note that after activating the video, data will be transmitted to YouTube. 
More Information

Acknowledgement

We thank our partners at Tescan, Luke Hunter and Wesley de Boever, for their excellent collaboration and for providing the in-situ µCT scans.