Optimization of Filter Media Structures with GeoDict
Increase dust holding capacity while maintaining pressure drop and β-ratio
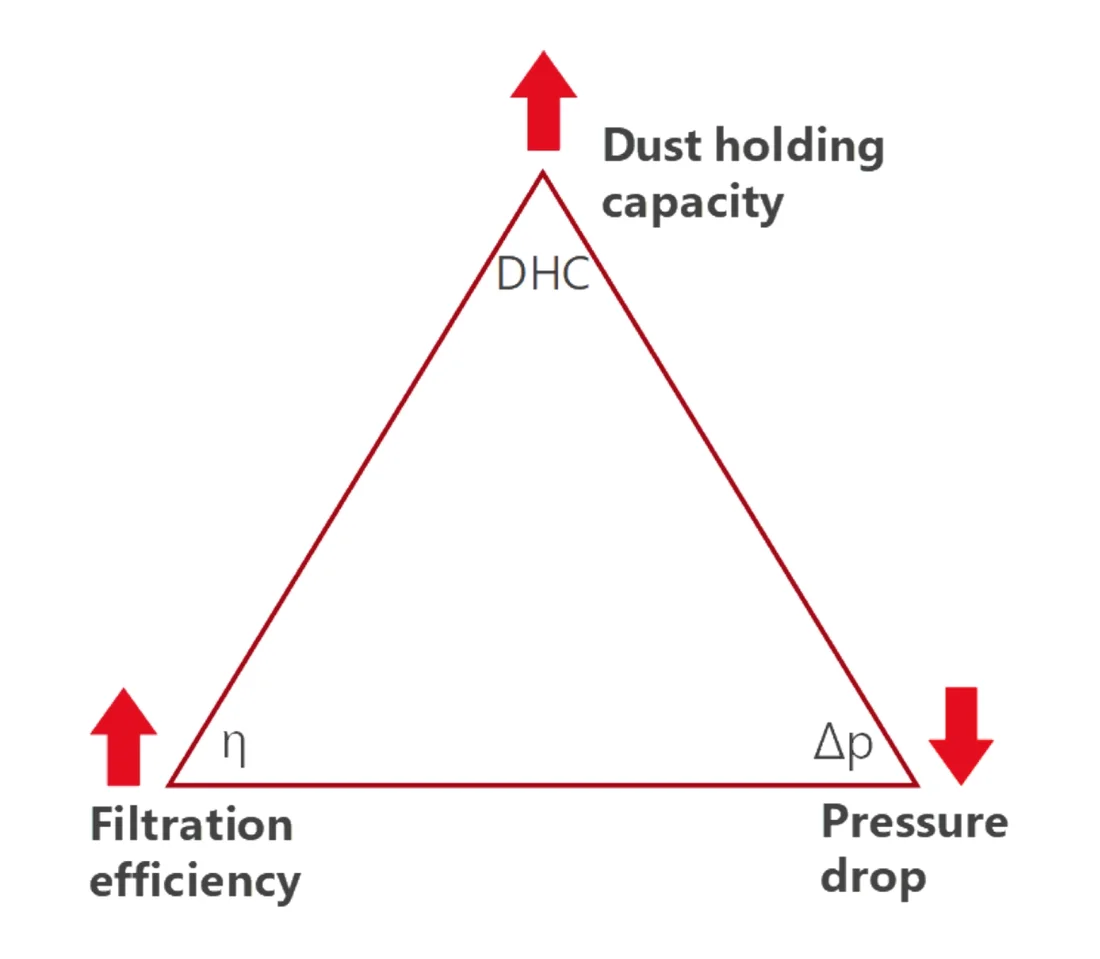
In general, the filter performance is determined by three key parameters:
Dust Holding Capacity (DHC): Indicates the amount of solid particles a filter medium can capture and retain before reaching the maximum allowable pressure drop.
Filter efficiency: Measures how effectively a filter separates solid particles, expressed as a percentage. For a given particle size, efficiency may be relatively low when the filter is clean but increases over its service life, as more particles are captured.
Pressure drop: The pressure difference between the filter inlet and outlet. This value increases over time as particles accumulate, pores become clogged, and flow resistance rises.
Summary of the procedure for structure generation and simulation:
- Generate a homogeneous structure
- Perform flow simulation of permeability and pressure drop using FlowDict
- Conduct an automated parameter study with FiberGeo and FlowDict to create linear and exponential structures with comparable permeability
- Run multi-pass simulations using FilterDict
Reference
Azimian, M., Kühnle, C. and Wiegmann, A. (2018), Design and Optimization of Fibrous Filter Media Using Lifetime Multipass Simulations. Chem. Eng. Technol., 41: 928-935. https://doi.org/10.1002/ceat.201700585

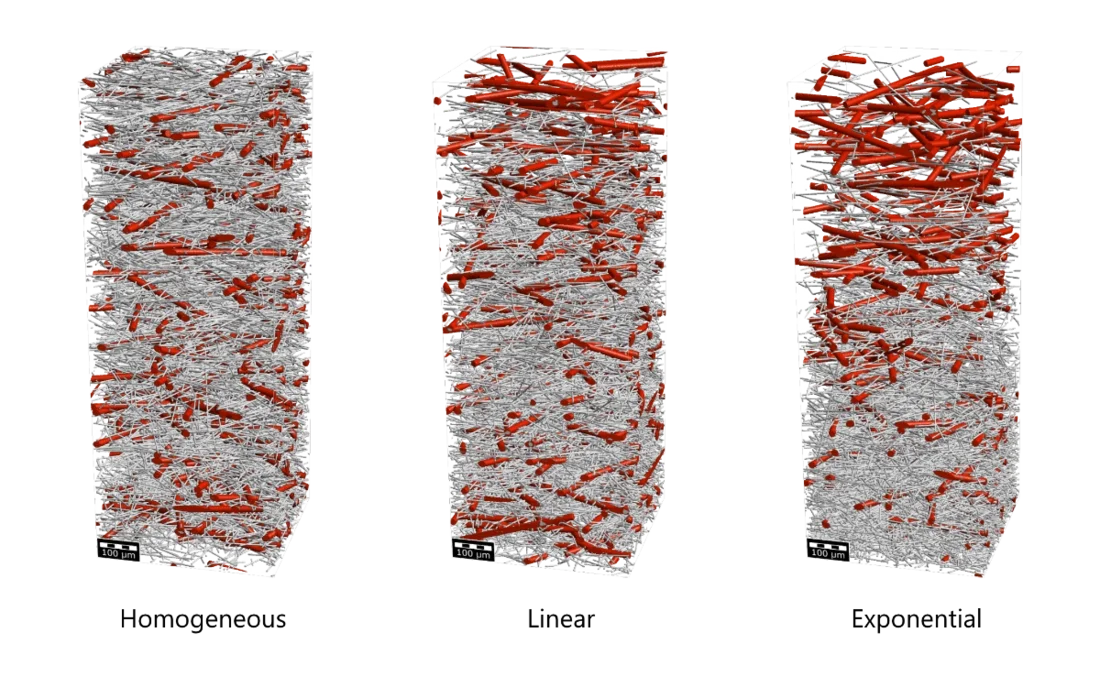
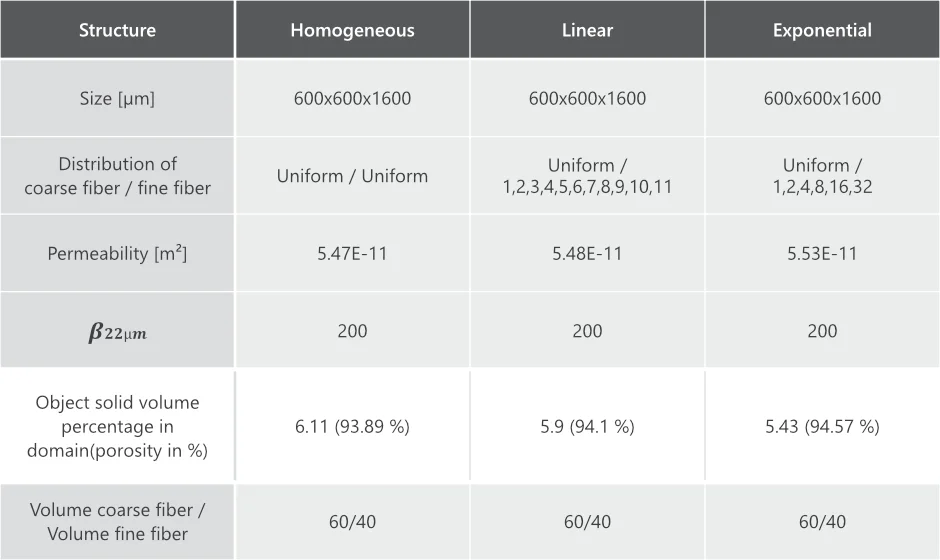
Three distinct filter media structures are modeled to schematically illustrate the development process.
Each structure is composed of two types of glass fibers with different diameters. The thicker fibers provide rigidity to the filter medium, supporting the finer fibers.
To ensure comparability of the boundary conditions, all three structures use the same fiber types and identical fiber diameters. The thick fibers are also statistically distributed in the same way across each medium. As a result, all structures share the same initial permeability and the same initial pressure drop. The only difference lies in how the fine fibers are distributed within the medium. Different distribution patterns are distinguished as follows:
- Homogeneous: The fine fibers are evenly distributed over the entire medium
- Linear: The number of thin fibers increases linearly over the depth of the medium
- Exponential: The number of thin fibers increases exponentially over the depth of the medium
The modelling and simulation of the fiber media in the parameter study was carried out automatically using GeoDict. The corresponding generated fiber media microstructures are shown below.
Flow simulation with FlowDict
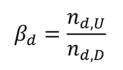
The so-called β-ratio is often used as a factor to determine the filtration efficiency. This is calculated in a multi-pass test from the ratio of particles upstream to particles downstream.
The β-ratio is specified with an index that indicates the particle size for which the ratio applies:
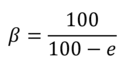
Accordingly, the filter efficiency is related to the β-ratio and can be calculated for a given particle size via :
FlowDict is used to simulate and verify the permeability and the initial pressure loss. If these values are not comparable across all three structures, additional structures with adjusted linear or exponential distributions are automatically generated. This process is repeated until both permeability and pressure loss are aligned.
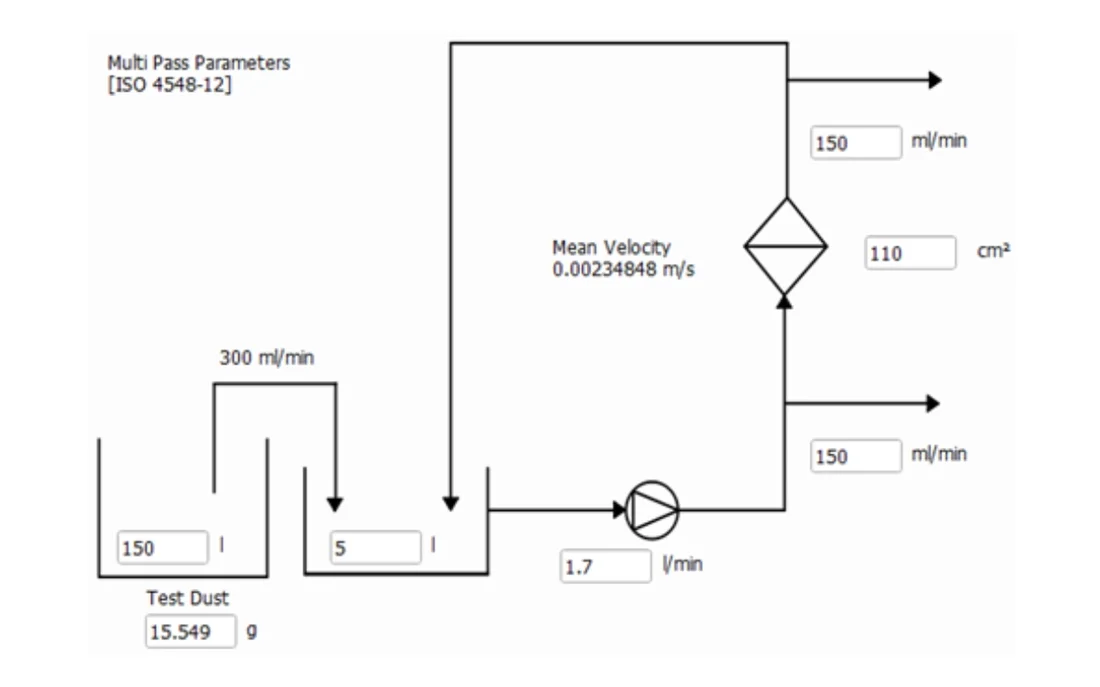
In the next step, all structures are subjected to a multi-pass test according to ISO 4548-12:2017 to determine their Dust Holding Capacity (DHC) and the associated pressure increase. This standardized test procedure, commonly used for hydraulic fluids and engine oil or fuel filters, measures filtration efficiency and pressure loss. Over the course of the test, particles accumulate in the filter, gradually blocking the pores. As a result, permeability decreases, filtration efficiency improves, and pressure rises over time.
In a multi-pass simulation, liquid circulates through the system, while the particle size distribution and concentration upstream of the filter evolve over time. In this case study, all multi-pass lifetime simulations were automatically terminated either after 20,000 seconds or once the inflow area became completely filled with particles.
To provide sufficient space for larger particles to deposit above the filter medium, the inflow area was extended by 200 voxels, resulting in a total structure size is of 600 x 600 x 1,800 voxels.
On a standard workstation equipped with 128 GB RAM and 12 parallel processes, each filtration simulation required approximately 1-3 days to complete.
Results of the multi-pass simulation
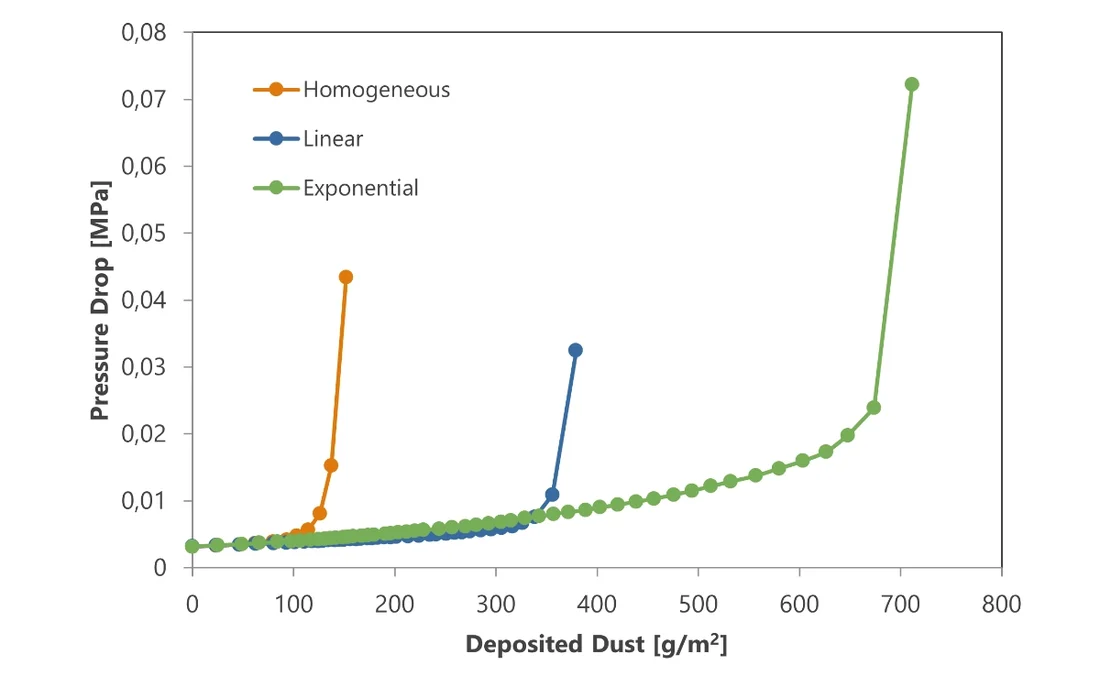
The graph illustrates that dirt holding capacity can vary significantly depending on the fiber distribution within the filter medium. For homogeneous and linear fiber distributions, filter cake formation is evident from a sharp rise in pressure. In contrast, with an exponential fiber distribution, no filter cake is observed even by the end of the simulation. In this case, particles penetrate deeper into the medium, delaying cake formation and the associated steep pressure increase.
In summary, a homogeneous fiber distribution shows clear disadvantages compared to linear and exponential distributions with respect to pressure drop. The results demonstrate that in homogeneous structures, a filter cake forms early, leading to a rapid rise in pressure.
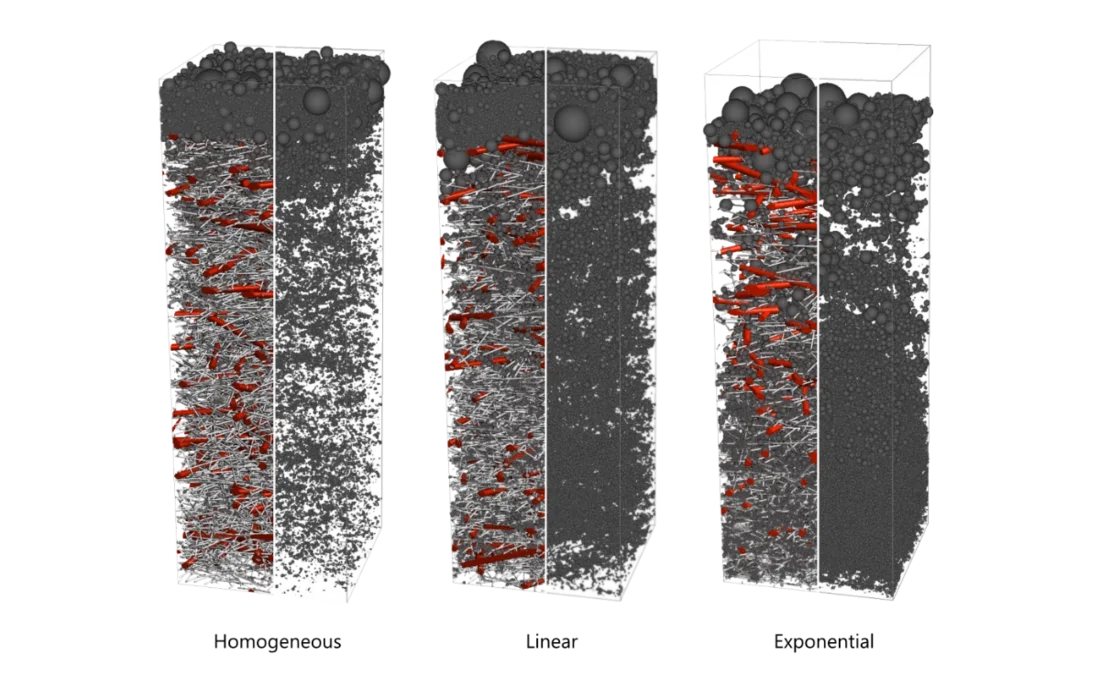
Visualization of the structures
The results, evident from the pure pressure curves, can also be visualized in GeoDict. The figures on the right clearly show the change in deposition behavior: in the homogeneous case, a filter cake forms quickly, allowing only a small portion of particles to enter the depth filtration. In contrast, the exponential structure accommodates significantly more particles before cake formation begins, delaying the sharp rise in pressure drop.
This case study demonstrates how GeoDict can be used to optimize existing filter media and design new ones with improved performance by tailoring the microstructure.