Scientific Visualization of Microstructures
Visualization with GeoDict
A good scientific visualization is essential for understanding complex physical phenomena, particularly in intricate microstructures and Multiphysics simulations. At the microscale, processes such as fluid flow, particle transport, heat transfer, or structural deformation occur within geometries that cannot be intuitively understood from raw numerical data alone. Visualization turns simulation-results into meaningful images, making otherwise invisible processes visible.
By presenting data in a clear graphical form, visualization reveals patterns, supports model validation, and provides deeper physical insight—helping researchers understand not only what is happening, but why. At the same time, it serves as a powerful communication tool, enabling complex results to be conveyed clearly to colleagues, customers, and interdisciplinary teams.
GeoDict is a powerful platform for advanced scientific visualization of complex microstructures and simulation results. It enables detailed 2D and 3D visualization of geometries, including gray-value images and surface triangulations. GeoDict allows simulation results such as flow fields, distance maps, pore-size distributions, strain tensors, and many more to be visualized in the most suitable form depending on the application—ranging from scalar field plots and tensor representations to streamlines and arrow-based vector visualizations.
In addition, GeoDict supports application-specific analyses such as 3D particle tracking (particularly relevant for filtration) and pore-size distributions shown as 2D and 3D visualizations with interactive plots. Its fast and memory-efficient rendering allows real-time exploration of large datasets. All visualizations can be exported as high-quality images and videos, making GeoDict both a powerful analysis environment and an effective tool for communicating complex scientific insights.
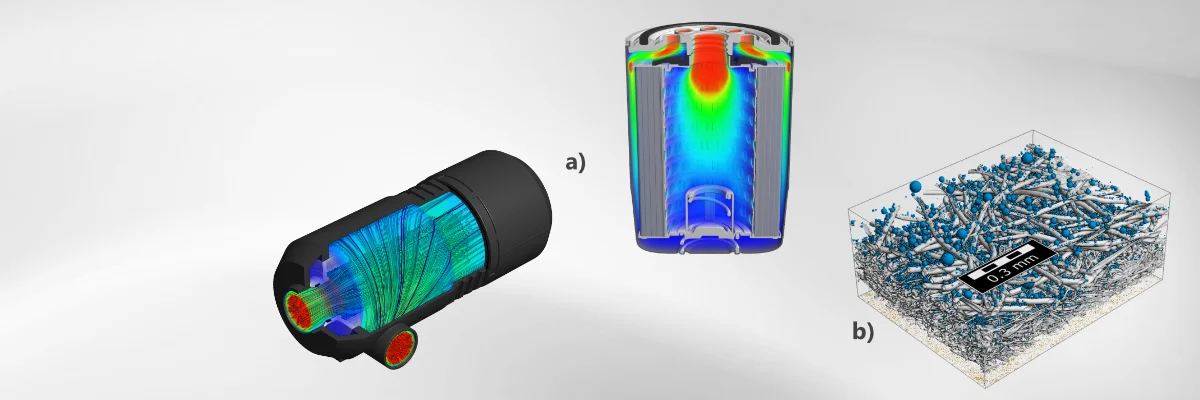
Visualization for filtration processes
a) Flow through Complete filter geometries
b) Particle filtration for a nonwoven in a face mask
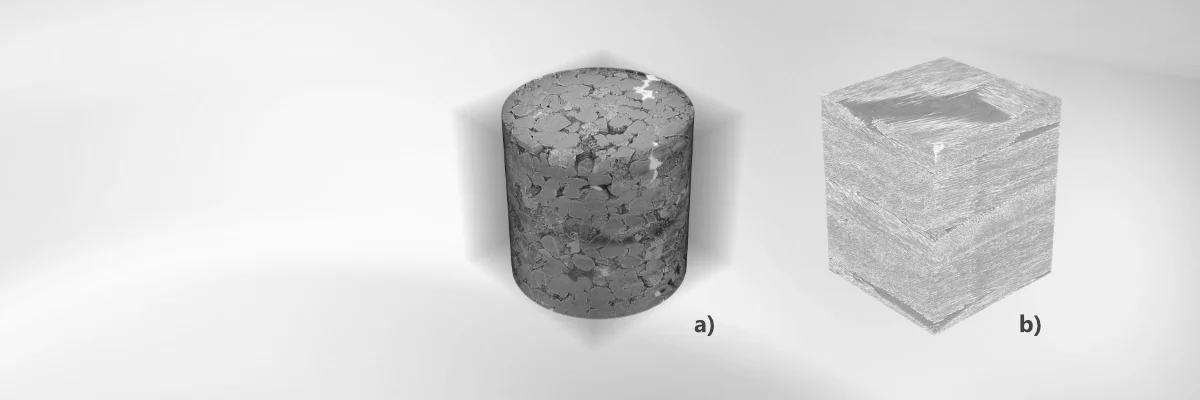
Visualization of CT-scans in 3D
a) Ct-scan of a Berea sandstone
b) Ct-scan of a carbon fiber composite
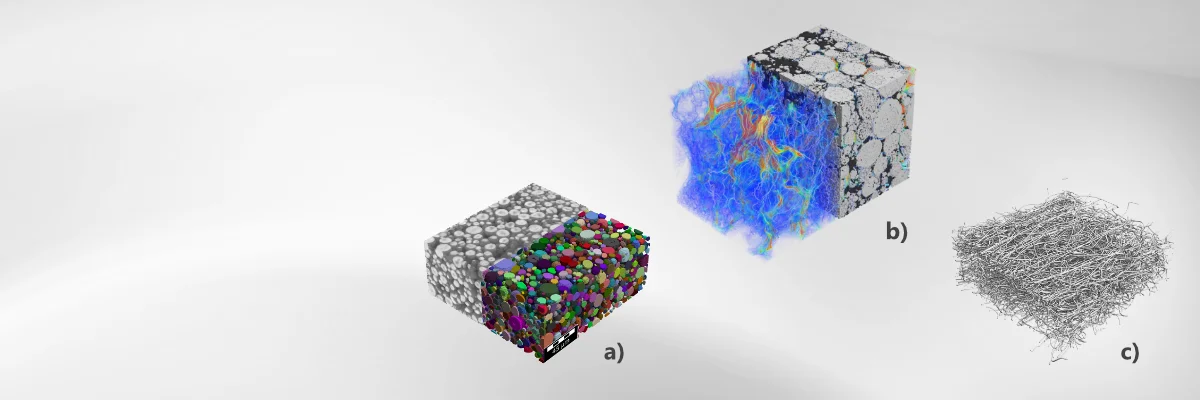
Visualization of microstructures and simulations in 3D
a) Battery electrode with identified particles
b) Transport simulation through a battery electrode
c) Nonwoven for hygiene application
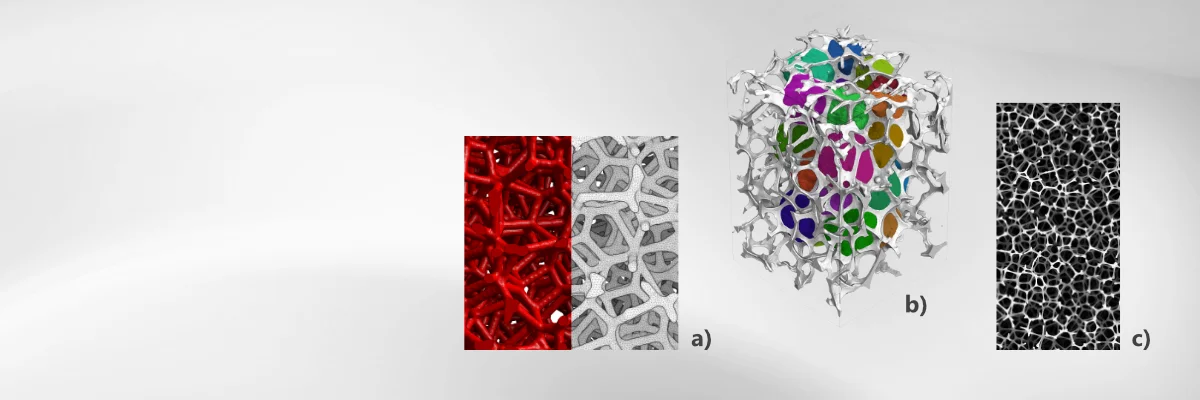
Visulaization of foams in 2D and 3D
a) Foam geometry and surface triangulation
b) Aluminum foam with identified cells
c) Foam geometry in 2D with depth information (REM view)
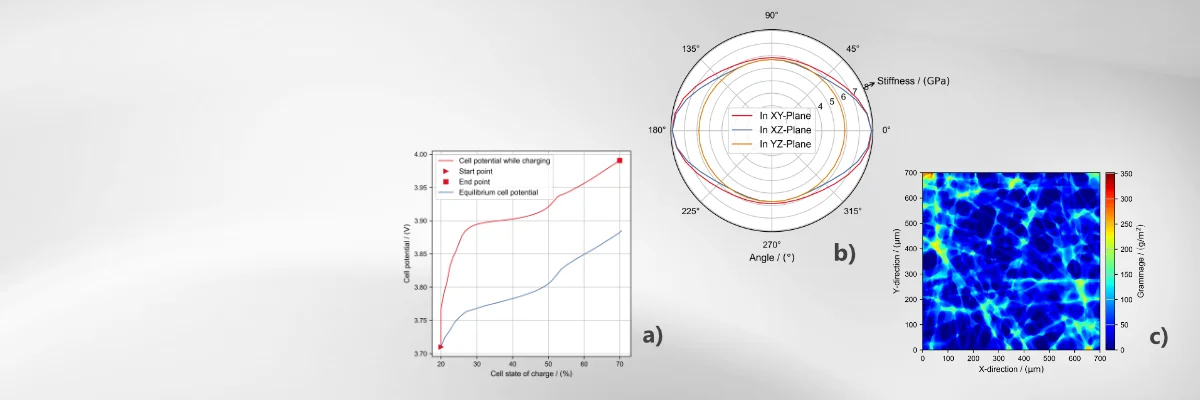
Interactive result plots
a) Battery charging simulation
b) Stiffness of composite material
c) Density distribution for GDL
- Comprehensive Geometry Visualization
- Visualization of complex 3D geometries in both 2D cross-sections and full 3D renderings
- Visualization of gray-value images, such as CT or voxel-based data
- Visualization of surface triangulations in 3D
- Advanced Result Field Visualization
- Visualization of simulation result fields, including flow fields, size distributions, distance maps, strain tensors, and many more
- Visualization of streamlines to analyze e.g. flow behavior
- Flexible representation of fields—e.g., streamlines, arrows, tensor plots—depending on user needs
- High-Performance Interactive Exploration
- Fast and memory-efficient interactive visualization in both 2D and 3D
- Real-time exploration of large datasets for immediate insight
- Multiple display controls such as adjustable legends, overlays, color/visibility settings, and bounding guides to customize views