Electrical Properties of GDLs: Experimental and Numerical Validation
Validation of Simulations with ConductoDict
GeoDict’s electrical conductivity simulations were validated by comparing numerical predictions with experimental measurements on Toray TGP-H-060 gas diffusion layers (GDLs) used in polymer electrolyte fuel cells.
High-resolution X-ray CT scans of the samples at different compression levels were reconstructed into three-dimensional digital microstructures, which served directly as input for conductivity simulations with ConductoDict. The experimentally measured in-plane and through-plane electrical conductivities under compression were then compared with the simulation results to assess the predictive accuracy of the model.
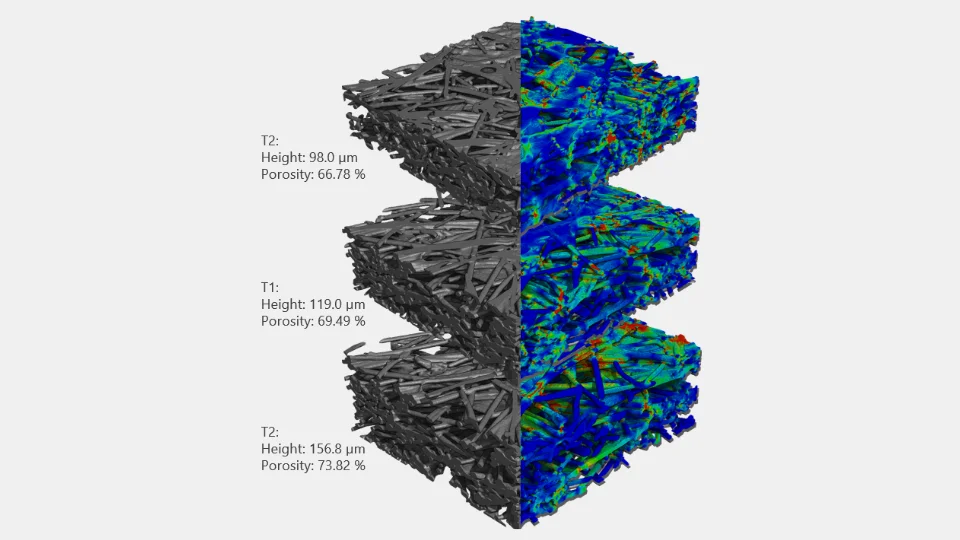
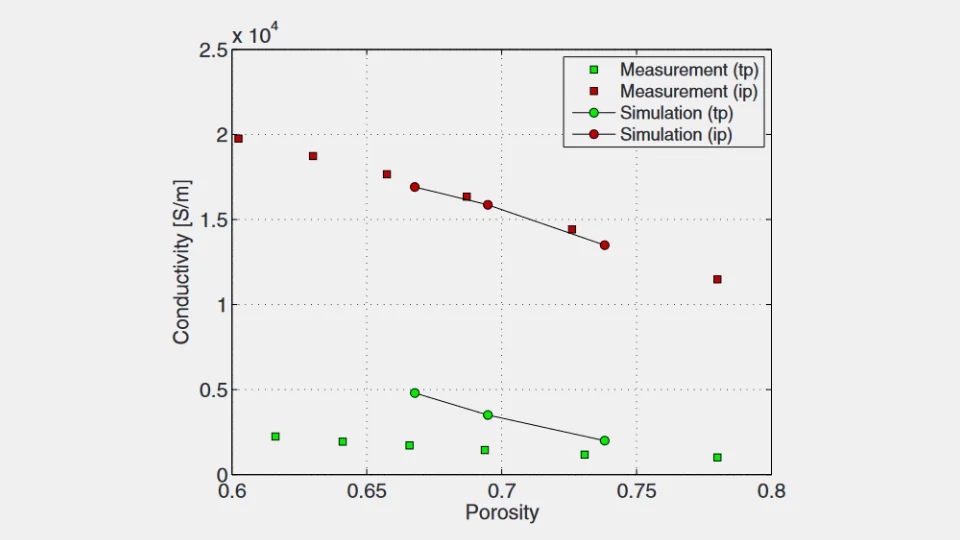
Figure 1 shows three reconstructed GDL structures with increasing compression. The colors on the right half of each structure visualize the simulated current density distribution. The graph shown in figure 2 compares the simulated conductivity values with the corresponding experimental measurements. For the in-plane direction, the GeoDict simulations show an excellent match with the measured data over the investigated porosity range.
In the through-plane direction, the simulations reproduce the trend but overestimate the measured values. Here, simulations and experiments deviate because contact resistivity between fibers could not be considered and the binder which glue the fibers together could not be distinguished from the fibers in the CT scan when the validation was performed.
With the newest GeoDict version, both limitations have been overcome. It is now possible to simulate contact resistance in ConductoDict, and the FiberFind module makes it possible to distinguish between binder and fibers in segmented CT scans.
