From Image to Insight: Inspection Images and Professional Reports in GeoDict

Hidden Gems Article #1

Hidden Gems series

GeoDict is an innovative, modular software suite for digital material research and development, developed by Math2Market GmbH. It enables 3D image processing, microstructural modeling, and simulation-based material characterization and property prediction. 

This series of short articles highlights selected “hidden gems” of the GeoDict software that may not be widely known. While these features are not new, they often remain underutilized in everyday workflows.

The objective is to provide concise, practical insights that support a growing user base. Each article focuses on one specific functionality and illustrates its application through a simple example. The format is intentionally brief and application oriented, allowing readers to quickly assess potential relevance for their own work.

For a more detailed demonstration or to discuss specific use cases, direct contact is welcome!


1. Introduction

Many GeoDict users focus on determining material properties. However, the value of these results often depends on how clearly they are documented, visualized, and shared.
This article presents a straightforward example based on a micro-CT scan of a concrete sample containing pores. Using this dataset, it illustrates how to generate:

  • Inspection-ready visuals, including contrasted slices, annotated measurements, and slice or 3D videos 
  • Quantified porosity through segmentation, volume fraction analysis, and per-pore statistics 
  • Structured output suitable for reporting, including standardized PDF reports and exportable graphs

All steps rely on automated, ready-to-use tools within GeoDict. The workflow demonstrates how raw CT data can be transformed into a concise, shareable porosity report within a short time. The resulting documentation combines visual evidence with quantitative pore statistics.

This approach is relevant for users who not only perform measurements, but also need to communicate CT-based results clearly to colleagues, customers, or decision makers.


2. Loading image and volume data

The first step is to load the dataset into GeoDict. This is done using the ImportGeoVol module, which supports a wide range of common 2D and 3D image formats.

  • 3D Image Data/Raw Files:
    • *.vol (3D binary float or integer data, 4-byte)
    • *.raw (8- or 16-bit, 32-bit integer raw data)
    • *.grw (GeoDict raw data format)
  • Computed Tomography (CT) Formats:
    • *.dcm, *.dmz, *.zip (DICOM files)
    • *.rek, *.iass (Fraunhofer)
    • *.txm (Zeiss 3D image)
    • *.am (Avizo binary voxel data)
  • 2D Image Formats (Image Stacks):
    • *.tif, *.tiff, *.png, *.jpg, *.jpeg (Stacks of 2D images)
  • And much more

If voxel size or the number of voxels in each spatial direction is not included in the file metadata, these parameters must be defined manually during the import process to ensure correct scaling and quantitative evaluation.

After import, the data can be reviewed and prepared for further analysis. The next step in the workflow is typically the Image Filtering window, where noise reduction filters can be applied and segmentation can be performed using different available tools in GeoDict.


3. Save contrasted CT slice images

In a typical inspection workflow, the first step after loading the data is to adjust image contrast. This can be done via the volume field Edit option by adapting the grayscale range.

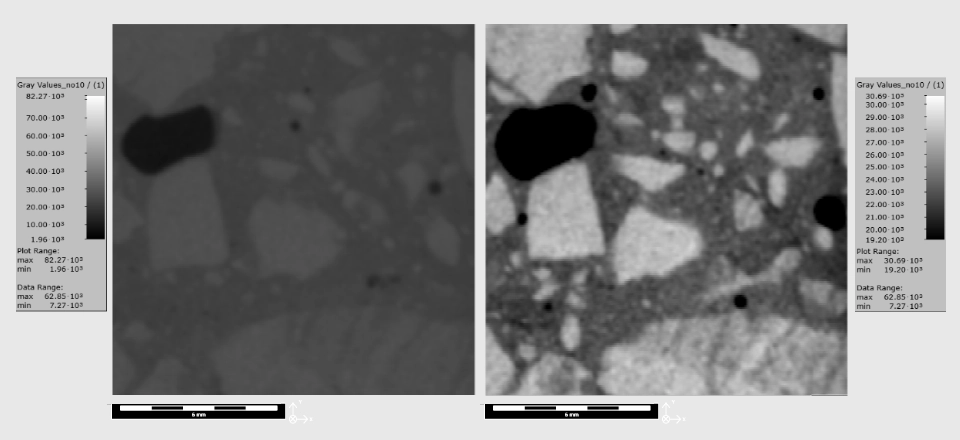
For illustration, the same 2D cross-sectional slice is displayed before and after contrast adjustment. Slice views can be selected along any spatial axis by choosing the respective direction and scrolling through the dataset. Zooming into regions of interest can help to examine specific features in more detail.

Image export

Individual slice images can be exported using the Save image as function. In the present example, contract adjustment improves the visual differentiation between pores, cement matrix, and aggregate particles within the concrete sample.

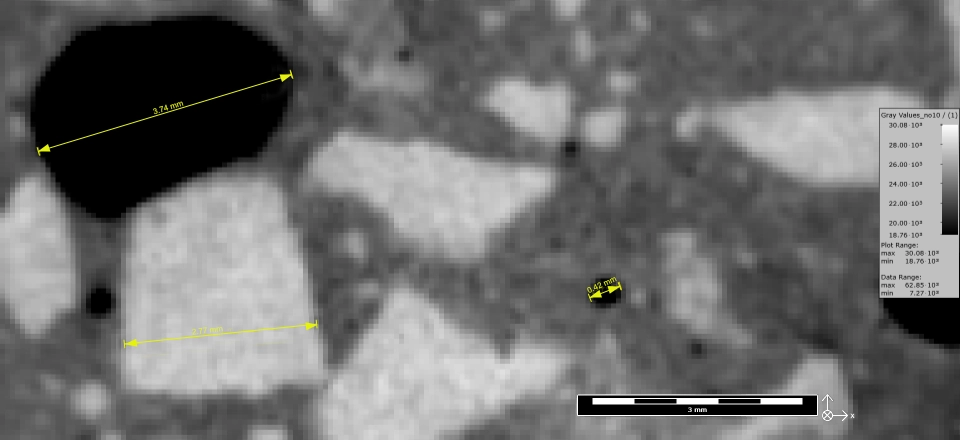
In addition to exporting individual slice images, simple geometric measurements can be performed directly within the visualization window. The linear distance measurement tool allows representative features to be quantified and documented. Images including these ruler-based measurements can then be saved for reporting purposes. An example is shown below, where characteristic features in the concrete sample are measured and annotated.

For a more comprehensive visualization of the dataset, 2D or 3D animations can also be generated. Animations provide contextual information across all slices and can support a clearer understanding of the spatial distribution of features. This format is often more suitable for sharing results with colleagues or stakeholders.

Video export

Using the Create Video option in GeoDict, slice sequences or 3D views can be exported directly. In the example shown, the videos were generated after contrast adjustment, without requiring segmentation or additional processing steps. This allows rapid preparation of visual material for inspection and communication purposes.


4. Image Processing and Segmentation

GeoDict’s Image Processing dialog provides a broad range of tools for filtering, enhancement, and segmentation of image data. Various de-noising methods are available, including advanced approaches such as non-local means filtering. In the present example, no additional filtering was required.

For segmentation, a straightforward automatic method was applied: global thresholding using the single-value Otsu algorithm. This method is suitable when grey value distributions of different phases are reasonably well separated. In cases where beam hardening, partial volume effects, or pronounced brightness gradients are present, local or adaptive thresholding methods, or AI-assisted segmentation approaches, may provide more robust results.

The resulting segmentation is automatically stored in GeoDict as a structure. This structure can be visualized as an overlay on the original grey value dataset. In the example shown below, pores are displayed as red overlay on the grayscale image.

For improved three dimensional visualization, the grey value volume can be cropped to focus on the region of interest. This makes the spatial distribution and connectivity of the pore structure more clearly visible in 3D.


5. Porosity Quantification and Reporting

Central questions are how porous the sample is, how the pores are distributed, and how these results can be documented in a transparent and reproducible manner.

Based on the segmentation, pore space can be visualized directly and the overall porosity can be obtained from the material statistics. By hovering over the object information in the upper left corner of the window, the void volume fraction is displayed. In this example, the total porosity of the analyzed volume is 4.4%. These values refer to the full dataset, while slice-specific information can also be inspected. Here, porosity corresponds to the void volume fraction within the selected volume.

For more detailed analysis, the PoroDict module is used. Within this module, the Identify Pores function calculates statistical information for each individual pore in the volume. Several parameters can be defined:

  • A minimum pore diameter. A value of three voxels is commonly recommended to suppress noise-driven components and partial-volume artifacts.
  • Inclusion or exclusion of pores connected to the bounding box. Excluding boundary-connected voids isolates enclosed porosity, while including them reflects open porosity.
  • Optional reconnection of fragmented pores. This can compensate for segmentation interruptions (e.g., thin throats), but should be applied with care to avoid merging physically separate pores.

After computation, the results are stored in a GeoDict result-file. This file provides access to statistical histograms and enables export of a standardized PDF report. The report summarizes key metrics such as the number of identified pores, total volume fraction, minimum and maximum pore size, and additional descriptors.

Statistical evaluations can include pore volume, equivalent spherical diameter, alternative diameter definitions, aspect ratio, sphericity according to different formulations, surface to volume ratio, and further shape related parameters. Histograms illustrate the distributions, for example for pore size, aspect ratio, or sphericity.

Beyond numerical analysis, three dimensional visualization supports interpretation. The computed results can be loaded as a volume field and displayed in the main GeoDict visualization area. For example, pores can be color coded according to equivalent spherical diameter, with larger pores shown in one end of the color scale and smaller pores at the other. Different color maps can be selected depending on reporting preferences.


6. Conclusion

The hidden gem here is not the calculation of porosity itself, but the complete workflow from raw CT data to a structured, standardized report within a single software environment. All steps, from visualization and segmentation to quantitative analysis and documentation, are performed directly in GeoDict without need for external tools. 

This integrated approach supports repeatability and consistency across projects. Results are not only correctly computed, but also documented in a transparent and comparable manner, facilitating internal review as well as external communication.

Using the PoroDict module, the workflow enables detailed pore quantification, three dimensional visualization, and automated report generation. The procedure demonstrated here can be applied to other datasets with minimal adjustments and is not limited to concrete samples. It is equally relevant for a wide range of porous materials and microstructures.

For futher information, a live demonstrations, or discussion of specific datasets and reporting requirements, direct contact is welcome. We would be happy to explore this with you.


Authors of the article

Anton Du Plessis, Ph.D.

is Director of Business Development, EMEA at Math2Market.

Do you need more information?

Book a consultation appointment with our experts online or contact us through the contact form!

Contact us