FIB-SEM: A Complete Beginner’s Guide to High-Resolution 3D Material Imaging
created by Anton Du Plessis, Ph.D.
Why FIB-SEM Matters Today
Understanding the internal structure of materials at the micro- and nano-scale is essential for predicting how these materials behave at the macroscale. Features like pores, cracks, grains, fibers, and different material phases directly influence properties such as strength, conductivity, permeability, lifetime, and filtration performance.
For this reason, many industries rely on high-resolution imaging techniques to understand their materials better. Battery developers analyze electrode porosity, filtration experts study fiber networks, geoscientists explore pore pathways in rocks, and biologists look at complex biological tissues and their arrangements at the cellular level.
However, observing and analyzing structures at such small scales is challenging. Traditional microscopy is often not high enough in resolution. Scanning Electron Microscopy (SEM) is a powerful imaging tool that is widely used for this purpose – to image and analyze materials at the nanoscale. However, SEM provides only 2D views and cannot capture the true 3D organization of materials. This is where FIB-SEM (Focused Ion Beam – Scanning Electron Microscopy) becomes a powerful 3D imaging technique.
What Is FIB-SEM?
FIB-SEM combines two advanced instruments into one system:
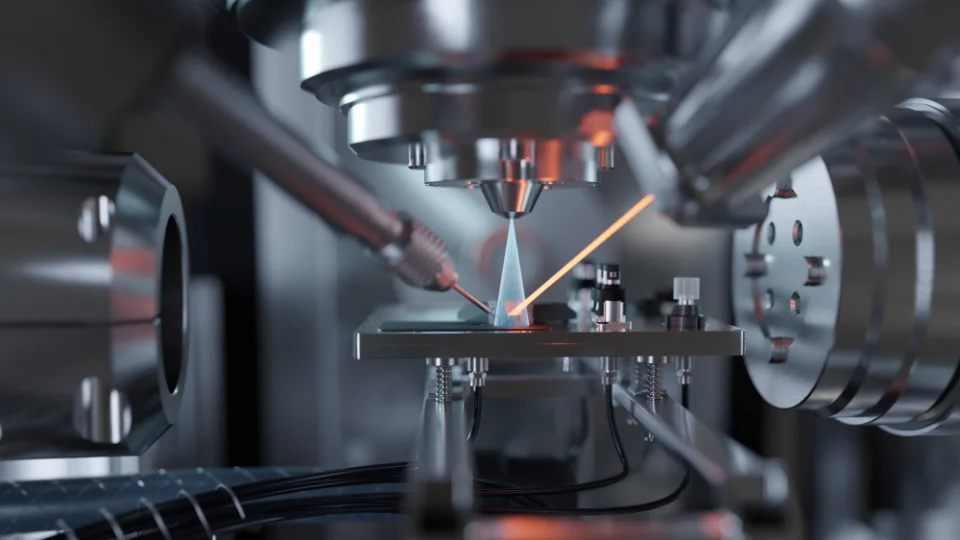
Focused Ion Beam (FIB): Uses ions to precisely mill or remove tiny slices of material.
Scanning Electron Microscope (SEM): Uses electrons to scan the freshly exposed surface and produce high-resolution images.
Simple explanation:
FIB-SEM works like cutting a material into extremely thin slices—each slice only nanometers thick—while taking a picture of every new surface. These images can later be combined into a 3D dataset.
Key advantages
- Extremely high spatial resolution (down to a few nanometers)
- Ability to target specific regions of interest
- High contrast for different phases and materials
- Enables true 3D reconstruction via serial sectioning
SEM is used daily in research labs worldwide because it shows details that most other imaging methods simply cannot reach. FIB-SEM takes this to the third dimension providing real 3D image data at the nanoscale.
How Does FIB-SEM Work?
Although systems vary, the general workflow is:
Step 1: Sample Preparation
The material is trimmed, mounted on a stub, and placed into vacuum.
Step 2: Ion Beam Milling
A very thin slice of material (typically 5–50 nm) is removed with high precision.
Step 3: SEM Imaging
The SEM scans the exposed surface and produces a detailed grayscale image.
Step 4: Serial Slicing and Imaging
This cycle repeats hundreds or thousands of times to capture the entire 3D volume of interest.
Step 5: 3D Reconstruction
The 2D slices are aligned and stacked to form a high-resolution 3D representation of the microstructure.
In simple terms:
It’s like peeling a material layer by layer and taking a photo after each peel.

What Do FIB-SEM Images Look Like?
Interpreting greyscale contrast
FIB-SEM images appear in grayscale. Different materials and phases show different brightness levels:
- Bright: heavier or denser materials
- Dark: pores, voids, low-density regions
- Intermediate shades: different material phases
Common features present in FIB-SEM
Typical features visible in FIB-SEM images include:
- Pores and pore networks
- Grain structures in metals
- Phase boundaries in composites
- Particle networks in battery electrodes
- Cracks, inclusions, and defects
Value of 3D reconstructions
3D reconstructions reveal how these features connect, overlap, and influence material behavior.

Variations of FIB-SEM Systems
Different FIB-SEM technologies exist, each optimized for specific tasks:
Gallium FIB
- Standard choice in most labs
- High precision, ideal for detailed small volumes
Plasma FIB (Xe-FIB)
- Much faster milling
- Perfect for larger 3D volumes
Cryo-FIB
- Used for temperature-sensitive or beam-sensitive materials
- Reduces damage and preserves native structures
Multi-beam and high-current systems
- Increase throughput
- Useful when many slices are needed quickly
Simple explanation:
Some systems cut slowly but very precisely; others cut faster when bigger volumes are needed.
Alternative 3D Imaging Approaches Related to FIB-SEM
While FIB-SEM is one of the most widely used tools for nanoscale 3D imaging, it is not the only technique capable of reconstructing volumes from serial sections. Several complementary methods exist, each with unique strengths and limitations. Understanding these related techniques helps researchers and engineers choose the right tool for their material and research question.
Serial Sectioning SEM (Mechanical or Laser-Based)
Instead of using ions to mill the surface, serial sectioning SEM removes layers mechanically (e.g., using a microtome, diamond knife, or laser) and then images each exposed surface with SEM.
Key characteristics:
- Works for larger volumes compared to FIB-SEM
- Lower risk of ion-beam damage
- Resolution depends on sectioning method (typically micro- to sub-micron scale)
- Often used for polymers, composites, and biological tissues
In simple terms:
It is like slicing the material with a knife and imaging each slice rather than milling it with ions.
Array Tomography
Array tomography prepares ultrathin sections of the sample using an ultramicrotome, collects them on a substrate, and then images them in sequence with SEM or TEM.
Key characteristics:
- Suitable for delicate or beam-sensitive samples
- Ideal for biological materials or fine polymer networks
- Requires careful alignment of many individual slices
In simple terms:
You cut hundreds of extremely thin slices, lay them out like cards, and image them one by one.
Volume EM (Multi-Beam or Serial Block-Face EM)
Volume Electron Microscopy refers to a family of automated 3D imaging methods based on SEM:
Serial Block-Face SEM (SBF-SEM)
A diamond knife inside the microscope repeatedly removes ultra-thin layers, and the SEM images the freshly exposed surface.
Focused Ion Beam Volume EM
A close sibling of FIB-SEM but built for high throughput and automation, often with optimized detectors and slice-handling systems.
Multi-beam SEM
Uses dozens of beams in parallel to acquire large 3D datasets much faster.
Key characteristics:
- Highly automated
- Larger 3D volumes than standard FIB-SEM
- Excellent for biological tissues, neural circuits, and soft materials
- Resolution typically between micro-CT and FIB-SEM
In simple terms:
Volume EM automates slice-and-image workflows to create large 3D datasets with minimal user intervention.
Common Applications of FIB-SEM
FIB-SEM is used across many scientific and engineering fields. Some examples include:
Battery Materials
- Electrode porosity
- Particle cracking
- Solid-electrolyte interface studies
Geological Samples
- Pore connectivity and tortuosity
- Mineral phase distribution
Metals & Alloys
- Grain boundaries
- Precipitates and inclusions
Composites & Polymers
- Fiber orientation
- Interface quality
Filtration Media
- Fiber networks
- Pore size distribution
Advantages and Disadvantages of FIB-SEM
Advantages
- Nanometer-scale resolution
- True 3D structural information
- Phase and material contrast
- Ability to target specific microstructural features
Disadvantages
- Limited sample volume
- Long acquisition times
- Possible ion-beam damage
- Requires careful sample preparation
- Requires vacuum
Typical Challenges Users Face
Many FIB-SEM users encounter similar obstacles - especially when working with 3D data:
- Slice to slice image alignment / registration can be challenging
- Manual segmentation takes a lot of time
- Noise and artifacts make quantification difficult
- Large datasets become hard to handle
- Connecting structure to material performance is not straightforward
- Extracting quantities (porosity, grain size, tortuosity, etc.) requires additional software tools
- Comparing datasets across samples is challenging
These challenges are completely normal. Most labs perform qualitative or semi-quantitative analysis with standard tools - and that’s perfectly valid.


Turning FIB-SEM Images Into Quantitative Insight
Once a FIB-SEM dataset has been reconstructed (and visualized!) in 3D, the next step—when needed—is to extract measurable, material-relevant parameters from the structure. These quantitative metrics help researchers understand how microstructural features influence macroscopic behavior.
Common Quantification and Analysis Options Include:
✔ Phase Quantification
Determining the volume fractions of different materials or phases in the sample.
Example: Amount of active material vs. binder vs. pore space in a battery electrode.
✔ Pore-Structure Analysis
Computing values such as:
- Pore size distribution
- Specific surface area
- Pore volume fractions
- Pore connectivity
Useful for: filtration media, rocks, membranes, foams.
✔ Grain and Particle Statistics
Extracting metrics for solids such as:
- Grain size and shape
- Orientation distributions
- Particle agglomeration
- Grain boundary surface areas
Important in: metals, alloys, ceramics, catalysts.
✔ Connectivity and Pathway Analysis
Evaluating how pores or phases connect in 3D. This includes:
- Connected vs. isolated pores
- Percolation pathways
- Tortuosity (how “winding” the transport paths are)
Critical for: fluid flow, ion transport, thermal/electrical conduction.
✔ Fiber and Structural Network Analysis
For fibrous or network-like materials:
- Fiber diameter
- Fiber orientation
- Network density
- Node and branch statistics
Important for: filtration media, biological tissues, composites.
Why This Matters
These quantitative measures transform the FIB-SEM volume from a visual representation into a set of engineering-relevant parameters.
This enables:
- Comparing samples
- Tracking manufacturing changes
- Validating material models
- Predicting performance-related behavior
Extending the Workflow: How GeoDict Supports FIB-SEM Users
While many researchers and engineers stop after generating and visually inspecting their FIB-SEM images, others need deeper insight through advanced visualization, quantitative analysis, or even simulation. This is where GeoDict, developed by Math2Market, serves as a versatile extension - supporting everything from 3D visualization and measurement to digital material modeling and property prediction.
GeoDict enables you to:
- Import 3D FIB-SEM datasets
- Correct image misalignments and remove artifacts such as curtaining
- Clean, segment, and process complex structures
- Apply AI-based segmentation in challenging datasets
- Extract quantitative metrics and microstructure quantification such as:
- Pore size distributions
- Volume fractions
- Fiber diameters
- Grain statistics
- Tortuosity
- Connectivity
- Run physics-based simulations such as:
- Permeability and flow
- Diffusion and conductivity
- Mechanical properties
- Filtration performance
- Build high-fidelity digital twins of your material
- Modify parameters of the material and run simulations to investigate the influence of small variations in the material
- This process allows you to test many material designs digitally, saving time and money on physical prototypes
In simple words:
FIB-SEM shows what the structure looks like.
GeoDict helps you measure what it means, and simulate its actual behaviour.
It allows further investigations of structure variations to find the optimal material solution for your application.

Conclusion
FIB-SEM is one of the most powerful techniques for revealing the micro- and nano-scale structure of materials. It provides true 3D insights delivering real value in batteries, composites, geology, filtration, biology, and many other fields.
Most users rely on FIB-SEM primarily for imaging and qualitative analysis—and this alone already brings tremendous value. When deeper quantitative understanding is needed, image processing and digital modeling tools can extend these datasets to extract meaningful engineering parameters and simulate material behavior.
With GeoDict, Math2Market supports this workflow by helping researchers turn their FIB-SEM images into high-quality quantitative insights—when and if they need them.
Are you interested in testing the FIB-SEM workflow with GeoDict? Math2Market offers a free trial license that allows you to test the software's features.
With the trial version, you can use the software for 14 days to
- Import and visualize 3D structures,
- Perform simulations,
- Explore the functions of the various modules and
- Evaluate how GeoDict supports your research or product development tasks.
To request your trial license or learn more about GeoDict's features, visit the page
