Optimized Drug Delivery Using GeoDict’s Dissolution Simulation
Hidden Gems series, Article #4
created by Anton Du Plessis, Ph. D.
Hidden Gems series
GeoDict is an innovative, modular software suite for digital material research and development, developed by Math2Market GmbH. It enables 3D image processing, microstructural modeling, and simulation-based material characterization. This series of short articles provides insights into “hidden gems” of the GeoDict software. It aims to showcase some strong-points of the software, that are not new but are not widely known yet. The aim is to share information that is useful to a growing userbase, in a short format based on a simple example in each case. For more detailed demonstration or discussion, please get in touch directly.
1. Introduction
In pharmaceutical manufacturing, producing high-quality tablets and capsules is essential to ensure patient safety and achieve reliable, well-timed drug delivery. The industry is highly competitive, with several key success factors driving innovation:
- Reduced time to market
- Consistent product quality and reliability
- Accurate and controlled drug release profiles
Digital simulation helps pharmaceutical companies achieve these goals more efficiently by reducing reliance on costly and time-consuming physical prototyping cycles. By enabling virtual testing and optimization, simulation accelerates product development while improving confidence in product performance.
This article focuses on GeoDict’s Dissolution Simulation capability, a powerful, hidden gem tool for pharmaceutical R&D that supports the analysis and optimization of drug release behavior. Whether used as a standalone solution or as a part of a broader digital twin workflow, it provides extremely valuable insights into how microstructural design influences dissolution performance.
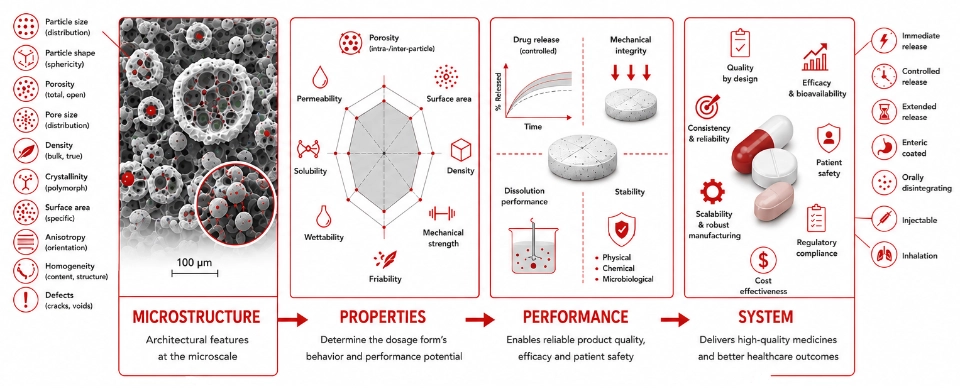
2. What is the concept?
The workflow begins with a micro-CT scan of a tablet or capsule. Micro-CT imaging captures the real three-dimensional microstructure of the product, providing detailed information about the geometrical features that strongly influence dissolution behavior.
The scan data can be used to quantify characteristics such as:
- Coating thickness
- Particle size distribution of active ingredients and excipients
- Material volume fractions
- Pore size distribution and connectivity.
After importing the microstructure into GeoDict, material properties are assigned to the different components of the formulation, such as active particles, matrix materials, pores, and coating layers.
The dissolution process is then simulated over time. Each material can be assigned its own dissolution kinetics, allowing the module to capture the individual behavior of the formulation components. Pores immediately provide pathways for fluid penetration, while variations in coating thickness influence when underlying materials become exposed and begin to dissolve.
The simulation produces a time-resolved 3D representation of the tablet, showing how each component dissolves and is released throughout the process. Because the analysis is based on the actual microstructure, including manufacturing-induced imperfections, the results provide a realistic prediction of product performance.
Once the baseline behavior is understood, developers can evaluate design alternatives either by analyzing additional physical samples or by digitally modifying the scanned structure. For example, increasing the coating thickness may delay the release of internal ingredients. The simulation quantifies this effect and allows it to be compared with other design variables, providing the insight needed to optimize formulations and achieve target release profiles more efficiently.
3. Example: Tablet Dissolution Simulation
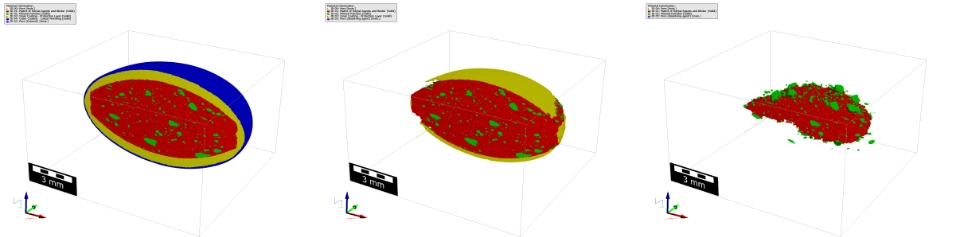
The dissolution process can be visualized throughout the entire simulation, providing detailed insight into how individual components are released over time.
The example shown below is based on a commercially available Sinupret® forte tablet. The tablet microstructure was obtained from a micro-CT scan with a voxel size of 12 microns, performed by RJL Micro & Analytic, a service provider and partner of Math2Market.
For visualization purposes, the different table components are represented using false-color coding:
- Exterior coating (blue)
- Barrier coating (yellow)
- Matrix material (red)
- Mineral particles (green).
The simulation calculates the dissolution process over a series of time steps. In this example, only three representative stages are shown, while the full simulation was performed using 50 calculation steps. The number of time steps can be adjusted by the user depending on the desired level of detail.
At each stage, the evolving tablet geometry can be examined in 3D, making it easy to identify how coating layers dissolve, when internal components become exposed, and how the release process progresses through the microstructure.
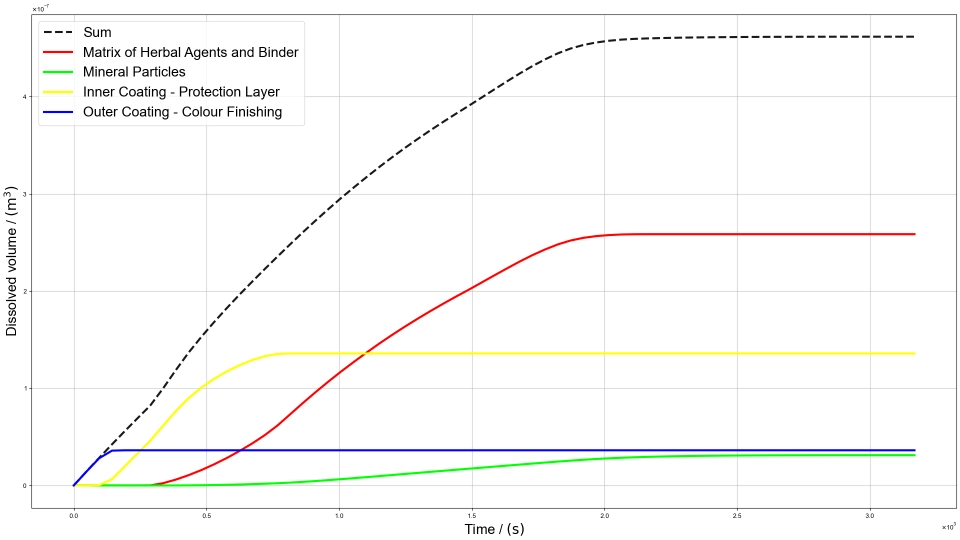
In addition to the visual representation, GeoDict generated quantitative results for each material phase. The dissolved volume of every component can be tracked throughout the simulation and exported as plots, enabling direct comparison of release behavior and supporting formulation optimization.